Sentencing in NZ - A workflow example
A first look at sentencing by demographic
Introduction
The aim of this semi-formal article is to obtain some insights into sentencing in NZ, and establish if and what demographic-based characteristics exist, while demonstrating my workflow and thought process.
Obtaining the Data
The Source
A quick google took me to Stats NZ, where I found what appeared to be their data extraction portal NZ.Stat.
This data portal was split into several “themes”, which was useful in enabling me to navigate to the base table Adults convicted in court by sentence type - most serious offence calendar year. This table had the following variables available for selection/customisation:
Now, the table functionality that NZ.Stat provides actually isn’t too bad (it works similar to a pivot-table found in spreadsheet software such as Excel), and a lot of information can be gathered just by using that - for example, expanding the gender field out quickly revealed 4x more total male convictions than female convictions.
Done! Analysis finished, and the conclusion is:
Males are treated unfairly
Ok facetious mode now off, and it’s obviously that there is a lot more to understand, and almost always anything in-depth requires getting detailed with the full data set; thankfully, the ability to export to an extract type file is provided.
Exporting the Data
Before exporting the data, I reviewed the fields, and decided to split the data out by the following fields:
- Main offence
- Gender
- Ethnicity
- Sentence
- Calendar year
The Age and Court fields I was content to leave aggregated for now.
The Export function itself provides a few options:

The Excel option looked like what was already displayed on the webpage, so not suitable as I wanted to do my own aggreations.
The CSV option is generally a solid standard option, however, on playing around with this functionality, I did actually hit the 1,00,000 row limit, and being emailed the reports sometimes took till the next day.
The SDMX option seemed good; I didn’t know what SDMX meant, but clearly it was some sort of XML file (which is another common format for data transfer). Generally, I’ve found XML to be more strict at following at specification.
Using the Compact Data option and exporting to SDMX gives a file like:
<?xml version="1.0"?>
<message:CompactData xmlns="http://www.SDMX.org/resources/SDMXML/schemas/v2_0/message" xmlns:common="http://www.SDMX.org/resources/SDMXML/schemas/v2_0/common" xmlns:compact="http://www.SDMX.org/resources/SDMXML/schemas/v2_0/compact" xmlns:oecd="http://oecd.stat.org/Data" xmlns:xsi="http://www.w3.org/2001/XMLSchema-instance" xmlns:message="http://www.SDMX.org/resources/SDMXML/schemas/v2_0/message" xsi:schemaLocation="http://www.SDMX.org/resources/SDMXML/schemas/v2_0/message http://www.sdmx.org/docs/2_0/SDMXMessage.xsd http://oecd.stat.org/Data http://WDMZAPP14.stats.govt.nz/RestSDMX/sdmx.svc/GetSchema/TABLECODE7353">
  <Header>
    <ID>none</ID>
    <Test>false</Test>
    <Truncated>false</Truncated>
    <Prepared>2018-05-15T11:56:33</Prepared>
    <Sender id="OECD"/>
  </Header>
  <oecd:DataSet xmlns:oecd="http://oecd.stat.org/Data" keyFamilyURI="http://WDMZAPP14.stats.govt.nz/RestSDMX/sdmx.svc/GetKeyFamily/TABLECODE7353/OECD/?resolveRef=true">
    <oecd:Series COURT_CLUSTER="T" MAIN_OFFENCE="01" AGE_GROUP="T" GENDER="M" ETHNICITY="C" SENTENCE="100" YEAR="1980" TIME_FORMAT="P1Y">
      <oecd:Obs TIME="9999" OBS_VALUE="19"/>
    </oecd:Series>
    <oecd:Series COURT_CLUSTER="T" MAIN_OFFENCE="01" AGE_GROUP="T" GENDER="M" ETHNICITY="C" SENTENCE="100" YEAR="1981" TIME_FORMAT="P1Y">
      <oecd:Obs TIME="9999" OBS_VALUE="21"/>
    </oecd:Series>
It was at this moment I thought about reverting back to CSV again, but I decided to persist.
Processing the Data
It seemed reasonably clear to me that each “row” that you’d find in the CSV export is represented by the oecd:Series element:
<oecd:Series COURT_CLUSTER="T" MAIN_OFFENCE="01" AGE_GROUP="T" GENDER="M" ETHNICITY="C" SENTENCE="100" YEAR="1980" TIME_FORMAT="P1Y">
  <oecd:Obs TIME="9999" OBS_VALUE="19"/>
</oecd:Series>
It was also clear that OBS_VALUE="19" was the value itself, i.e. the person count. What wasn’t clear was the apparent coding system being used, such as MAIN_OFFENCE="01" and ETHNICITY="C".
I was able to find the MAIN_OFFENCE classification, but needed to construct my own mapping for SENTENCE and ETHNICITY.
All this was incorporated into a program I wrote to convert the XML into a CSV file:
/+ dub.sdl:
    name "xml2csv"
    dependency "dxml" version="~>0.3.2"
+/

void main(string[] args) {
    import dxml.dom;
    import std.stdio;
    import std.algorithm;
    import std.range;

    if (args.length != 3) {
        writeln ("xml2csv in out");
        return;
    }

    // load offence codes
    import std.typecons : tuple;
    auto offenseCodes = File("offence_codes.txt")
                            .byLineCopy
                            .drop(1)                            // get rid of header
                            .map!(a => a.replace("\r",""))      // some files have nix terminators
                            .map!(a => a.splitter("\t").array)
                            .map!(a => tuple(a[0],a[1]))
                            .assocArray;

    auto ethnicCodes = ["C" : "European",
                        "M" : "Maori",
                        "P" : "Pacific",
                        "O" : "Other",
                        "X" : "Unknown/Corporation"];

    auto sentenceCodes = ["100" : "Imprisonment",
                          "200" : "Community",
                          "16" : "Monetary",
                          "23" : "Other",
                          "29" : "Not recorded"];

    auto getDescription(T) (T attribute) {
        import std.format : format;
        switch (attribute.name) {
            default: return attribute.value;
            case "MAIN_OFFENCE":
                return offenseCodes[attribute.value];
            case "ETHNICITY":
                return ethnicCodes[attribute.value];
            case "SENTENCE":
                return sentenceCodes[attribute.value];
        }
    }

    // read xml
    import std.file : read;
    import std.conv : to;
    auto dom = args[1].read.to!string.parseDOM;
    auto dataSet = dom.children[0]  // messageCompactData
                      .children[1]; // oecd:DataSet

    // write output
    auto fileOut = File(args[2],"w");
    auto headerWritten = false;
    foreach (seriesEntry; dataSet.children
                                 .filter!(a => a.name.equal("oecd:Series"))) {
        if (!headerWritten) {
            fileOut.write (seriesEntry.attributes
                               .map!(a => a.name)
                               .joiner(","));
            fileOut.writeln (",VALUE");
            headerWritten=true;
        }

        fileOut.write (seriesEntry.attributes
                            .map!(a => getDescription(a))
                            .joiner(","));

        fileOut.writeln ("," ~ seriesEntry.children[0]
                                          .attributes
                                          .find!(a => a.name.equal("OBS_VALUE"))
                                          .front
                                          .value);
    }
}
I won’t go into the details of the code, but suffice to say, it makes a nice little CSV file to look at:
COURT_CLUSTER,MAIN_OFFENCE,AGE_GROUP,GENDER,ETHNICITY,SENTENCE,YEAR,TIME_FORMAT,VALUE
T,Homicide and Related Offences,T,M,European,Imprisonment,1980,P1Y,19
T,Homicide and Related Offences,T,M,European,Imprisonment,1981,P1Y,21
T,Homicide and Related Offences,T,M,European,Imprisonment,1982,P1Y,27
Investigating the Data
Now we are ready to investigate. Let’s keep in mind that first insight that leaped out initially:
Between 1980-2017, there have been 4x more male convictions than female.
Note: Although technically different, for this analysis I’m going to assume that the rate of convictions can be used as a proxy for the rate of offending.
Seems clear that the rate of offending is much high among males than females - let’s try get a better picture:
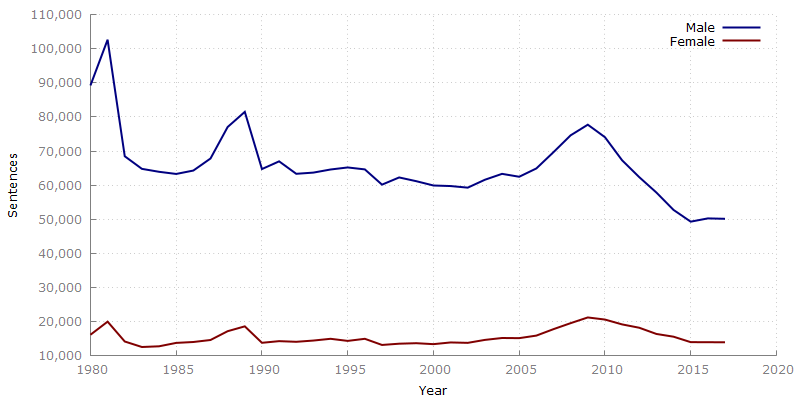
Figure 1: Total sentences per calendar year
Even a simple trendline as seen in Figure 1 shows some interesting things:
- Shows the overall “4x more male convictions” insight to be consistent throughout the time period, and not a result of a wild outlier
- The trends themselves are quite similar; male convictions go up between 1985-1989, female convictions go up; male trending downwards from 2010-2015, females also trend down
The second point I find quite interesting, and the most obvious factor I can think of is peaks/troughs in population, however, Figure 2 shows a fairly linear increasing population compared with the sentencing trends, which eliminates population spikes as a factor.
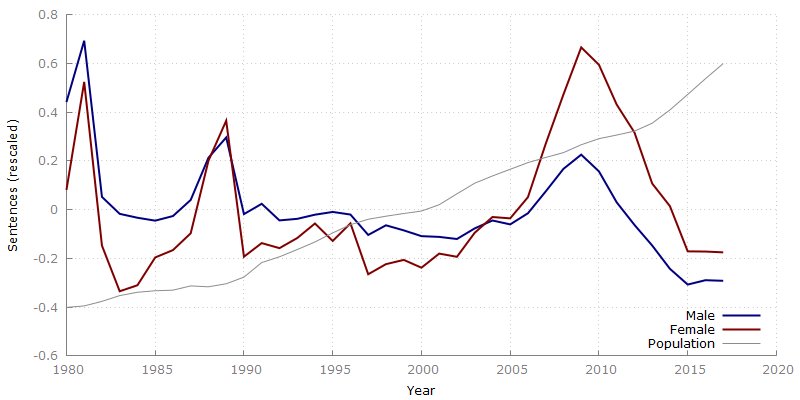
Figure 2: Mean normalised sentences (with mean normalised population imposed)
Note: By normalising the data, we can see more clearly that male and female have very similar peak/trough characteristics; good to see that whatever external factors ares causing spikes (perhaps policy or policing changes), it is being applied to male/females somewhat equally.
At this point, it’s unlikey that we can uncover any reason behind the higher rate of offending among males using our current dataset (I suspect sociological and even biological evidence would need to be introduced), nor the explainations behind the peaks/troughs of the offending (policy or policing changes would be the first thing I would look at), so regarding overall conviction rates, we have:
Average conviction rate of males per calendar year is 296 per 10,000 males.
Average conviction rate of females per calendar year is 72 per 10,000 females.
Note: The averages stated above are time weighted averages. The full dataset ranges from 1980 - 2017. Typically, you’d see either a total simple average across the years, or you’d pick the most recent year (or years), such as “average rate for the past 5 years”. In this case however, I wanted to keep the entire range of data, but give more emphasis on the recent years, which I’ve done using a simple linear weighting.
Offending Profile by Gender
Accepting the higher rate of offending amongst males, there is still plenty of insights to be uncovered; consider Figure 3:
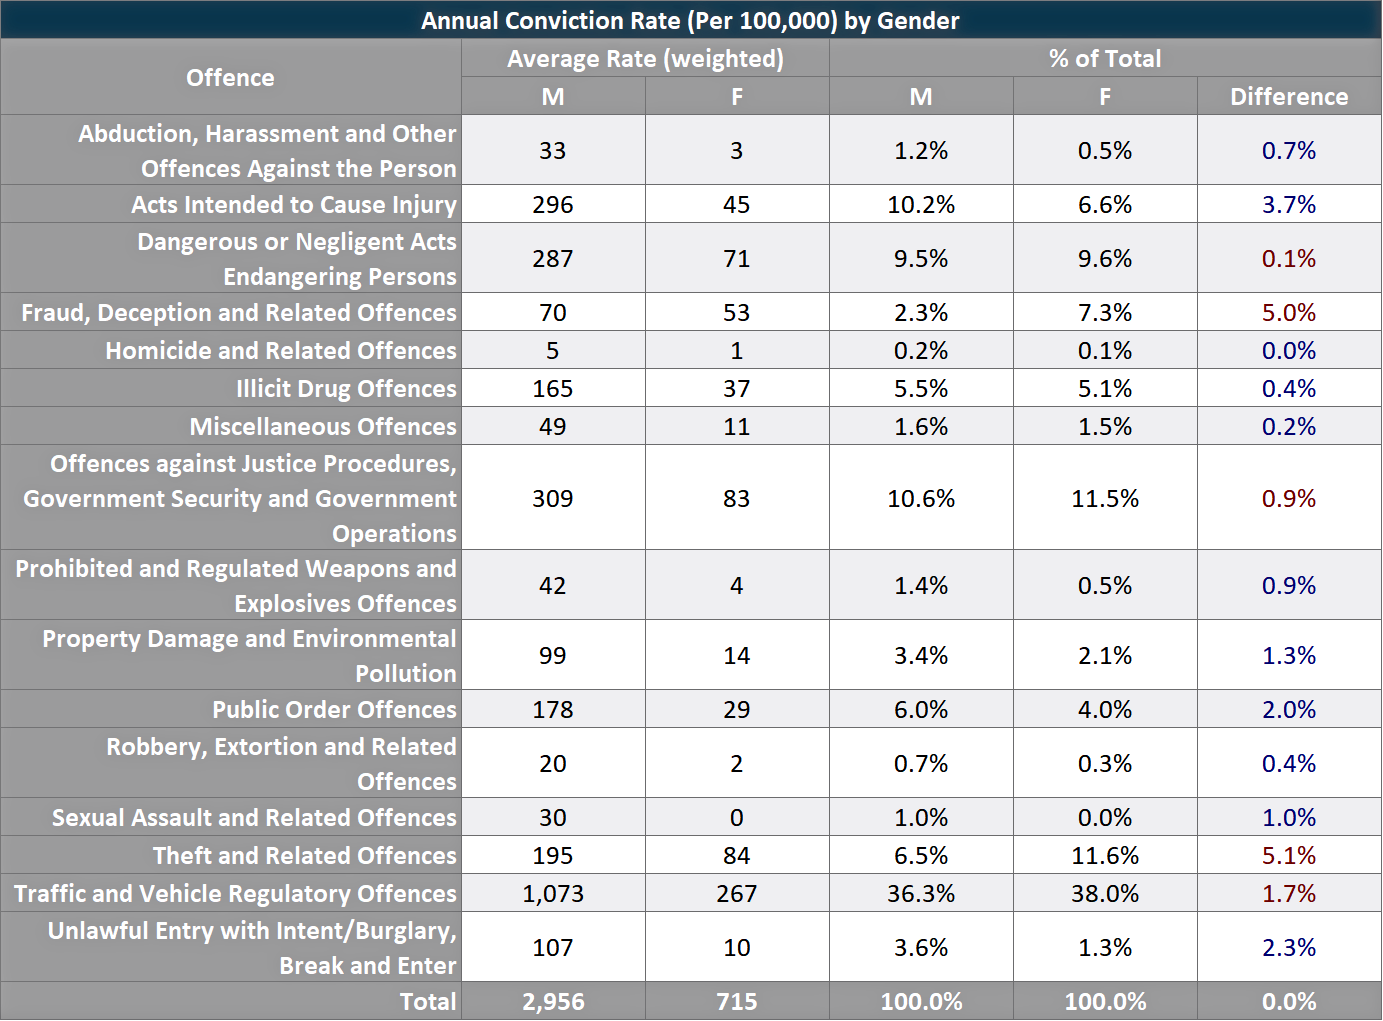
Figure 3: Conviction rates by Gender (blue: males proportionally higher, red: females proportionally higher)
Figure 3 (generated by a reporting program I wrote, reportd), shows the majority of offences for both genders to be traffic/vehicle related, with over 35% of all offence comitted falling into that category. Other categories show distinct variations by gender however, with Sexual Asault and Related Offences almost being exclusively male, and the following offence categories having much higher rates compared with females:
- Unlawful Entry/Break and Enter (11x higher than female)
- Weapons/Explosives (11x higher)
- Abduction/Harassment (10x higher)
- Robbery (9x higher)
Some interesting characteristics appear when looking at things at a proportional level:
- Theft makes up 12% of total female offending (compared with 7% for males)
- Fraud/Deception is 7% of total female offending (compared with 2% for males)
- Acts Intended to Cause Injury is 10% of total male offending (compared with 7% for females)
We’ve laid the groundwork for understanding of the nature of offending by gender, and although there is more area to investigate (how specific offences trends over time would be interesting), we can still add to our findings:
Male rate of offending is 4x higher than females.
Male rate of offending is 10x higher compared with females with what could be considered to be more violent offences (Break/Enter, Weapons/Explosvies, and Abuction/Harassment).
Females tend have higher relative proportions of Theft and Fraud/Deception than males.
Sentencing
The final component to add to our analysis is sentence given in court as a consequence for the reported offence. I’ll begin with traffic related offences, as that provides a nice large sample group:
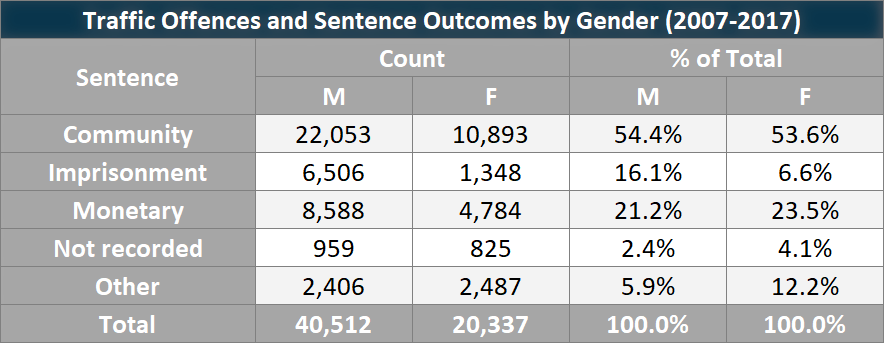
Figure 4
A couple of interesting points can be seen from Figure 4, males have a larger proportion of imprisonment than females, while females have a larger proportion of Other sentences. I want to try quantify the imprisonment imbalance first, so used contingency tables to generate the following insight:
Males are 2.7 times more likely to be imprisoned for a traffic offence than females.
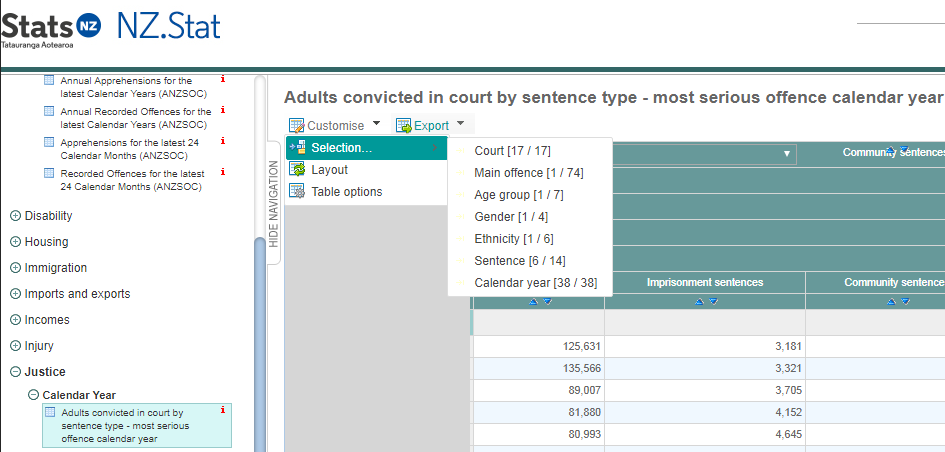
Now we are reaching the point where we need to be cautious; care needs to be taken when trying to identify areas of gender or racial bias. Even in the seemingly simple case above, there is actually alot of contextual information that needs to be known. For example, this screenshot from the NZ.Stat site:
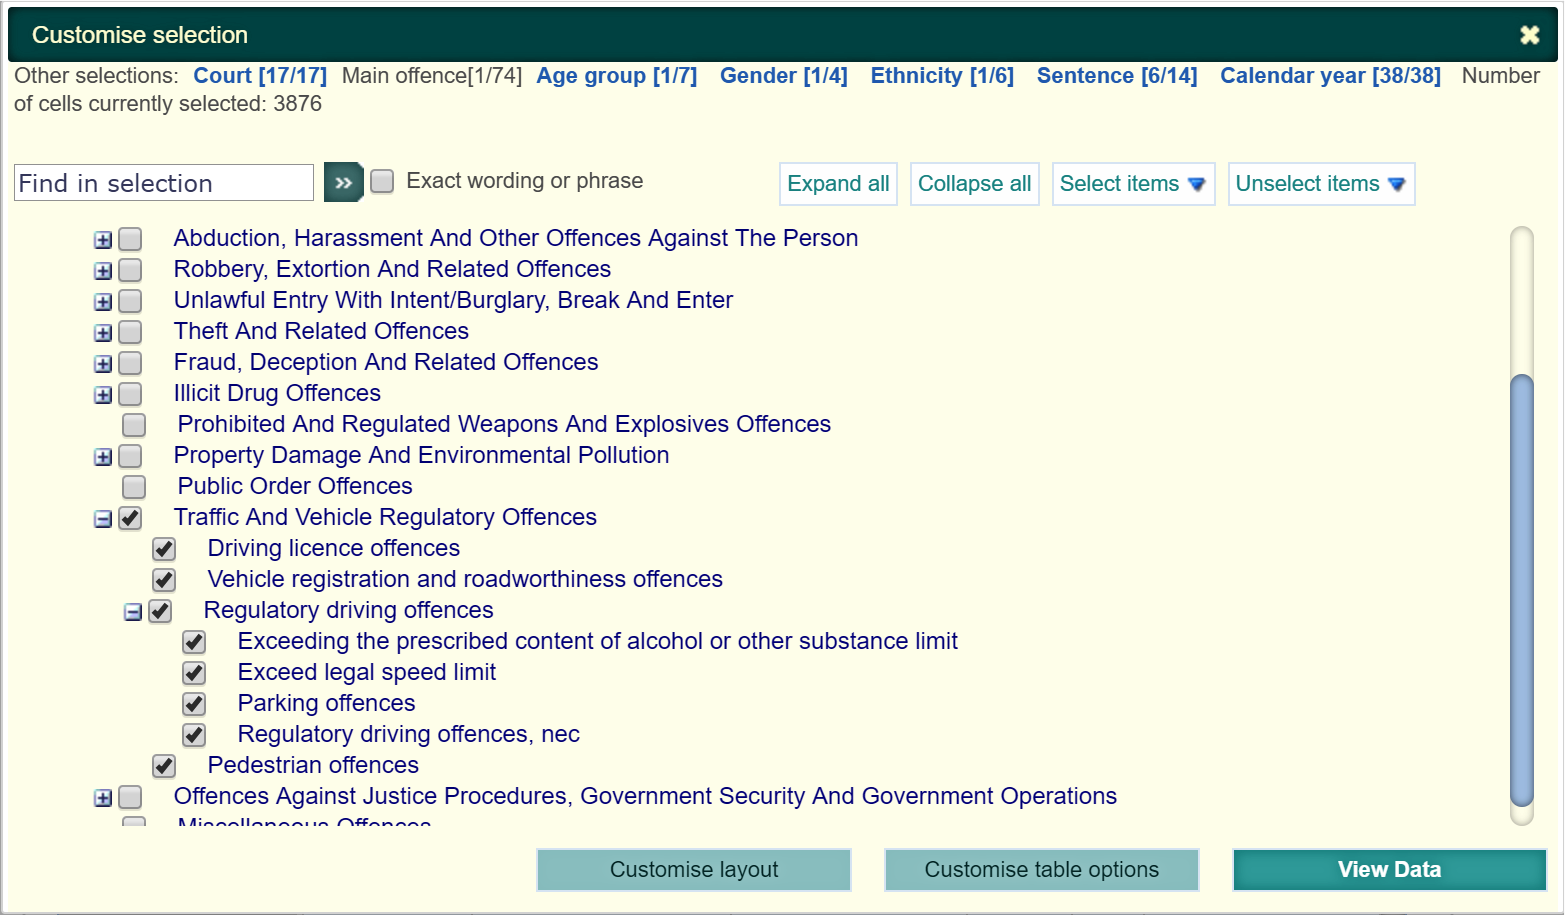
There are 7 total subcategories for traffice offences, and it’s clear to see there is a difference in “seriousness” between them (i.e. parking vs excessive alchol/drug). It’s important to establish as much as possible a direct “like-for-like” comparison, so I need to drill down even further by specific offences, see Figure 5:
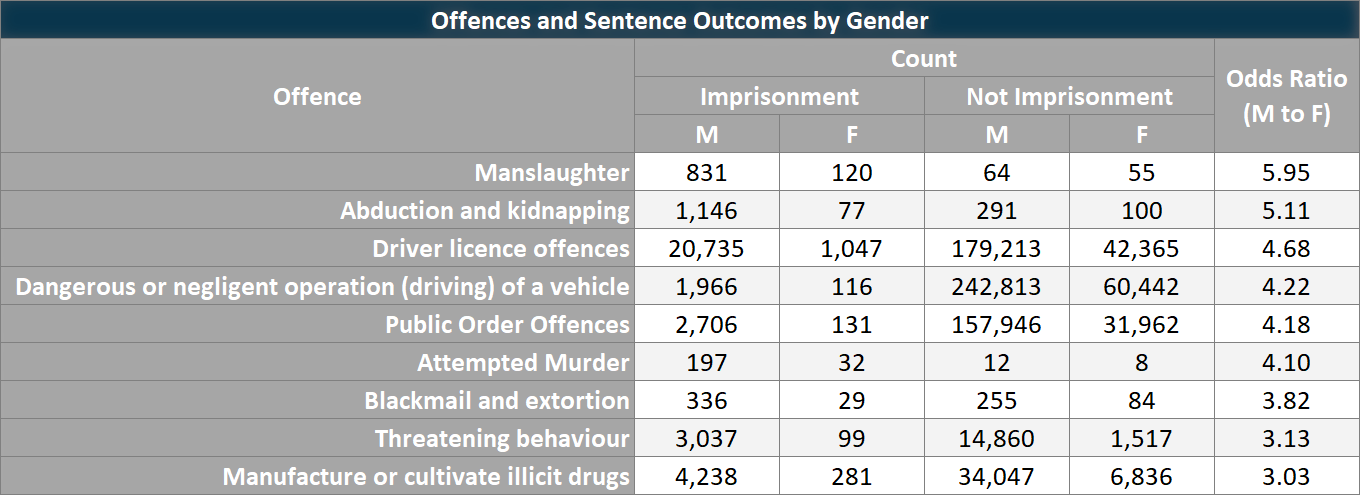
Figure 5: Sentence Count by Gender
Figure 5 is a cut down version of my full analysis, showing the offences that show a particular high gender imbalance. Although not a legal expert by any means, it’s hard to think any reason for the imprisonment rate imbalance for an like abduction/kidnapping, so the fact that males are 5 times more likely than females to receive an imprisonment sentence does seem interesting.
Sentencing itself would be the next level of detail to dive into, and try an uncover that if females are less likely to receive imprisonment, what are they more likely to receive (i.e. community detention or intensive supervision)?
So from Figure 5 (but the full table showing 41 different offences), we can see that:
Males are on average 2.6 times more likely than females to receive an imprisonment sentence, for the same offence.
Future Work
For the purpose of demonstrating my thought processes and workflow, what I have in this post is sufficient, although there is alot of scope for continuation of this analysis:
- Split sentence type out
- View sentence types over time, i.e. is home detention increasing vs. imprisonment?
- View offence types over time, i.e. is the more serious offending increasing/decreasing?
- Repeat all the analysis, but by ethnicity
My workflow tends to be table-based initially, with a few simple charts; once I understand the data and insights, more advanced data visualisation and infographics can be generated.
Summary
It’s been about a week since playing around with the data; I had not seen any of this NZ.Stat data before, so potentially my lack on contextual knowledge may have effected results; even so, here are my findings:
Male rate of offending is 4x higher than females.
Male rate of offending is 10x higher compared with females for the offences Break/Enter, Weapons/Explosives, and Abduction/Harassment.
Females have higher relative proportions of Theft and Fraud/Deception than males.
Males are on average 2.6 times more likely than females to receive an imprisonment sentence, for the same offence.
Any questions or comments about the analysis, I’d be happy to hear from you.

Twitter
Google+
Facebook
Reddit
LinkedIn
Email